Guide
How to Benchmark Nursing Home Reimbursement Rates
The short version
Comparing what nursing homes actually get paid is hard, because commercial rates are set in private contracts and most public data only shows Medicare and Medicaid. Federal Transparency in Coverage data now exposes payer-negotiated commercial rates, but the numbers need care: they are as reported by payers, and they only mean something next to the right peers.
Why rate benchmarking is hard
Reimbursement comes from several sources, and the most valuable ones are the hardest to see. Medicare and Medicaid rates are largely public, but commercial rates are negotiated privately between each payer and provider. So a facility can look average on public data while its commercial contracts tell a very different story, and there has historically been no easy way to compare those contracts across facilities.
What data actually exists now
Under the federal Transparency in Coverage rule, most health plans must publish the rates they have negotiated with providers in machine-readable files. That is a large shift: commercial rates that used to be private are now disclosed. It is also a large and messy dataset, and turning it into a clean, facility-level comparison takes real work.
The caveats that matter
Rate data is powerful, but it should be read with a few things in mind:
- Reported, not final. The published rates are as reported by payers and may not reflect every contracted amount or all applicable terms.
- Matching is the hard part. Rates have to be tied to the right facility, which means matching on provider identifiers such as the NPI, not just a name.
- Use it for benchmarking. It is best treated as a comparison and planning tool, not a quote.
Compare to true peers, not averages
A rate only means something in context. State and national averages wash out the local market and the mix of services a facility provides, so the useful comparison is against true peers: nearby facilities of similar type competing for the same residents and payers. That is the same true-peer logic behind market analysis and acquisition due diligence.
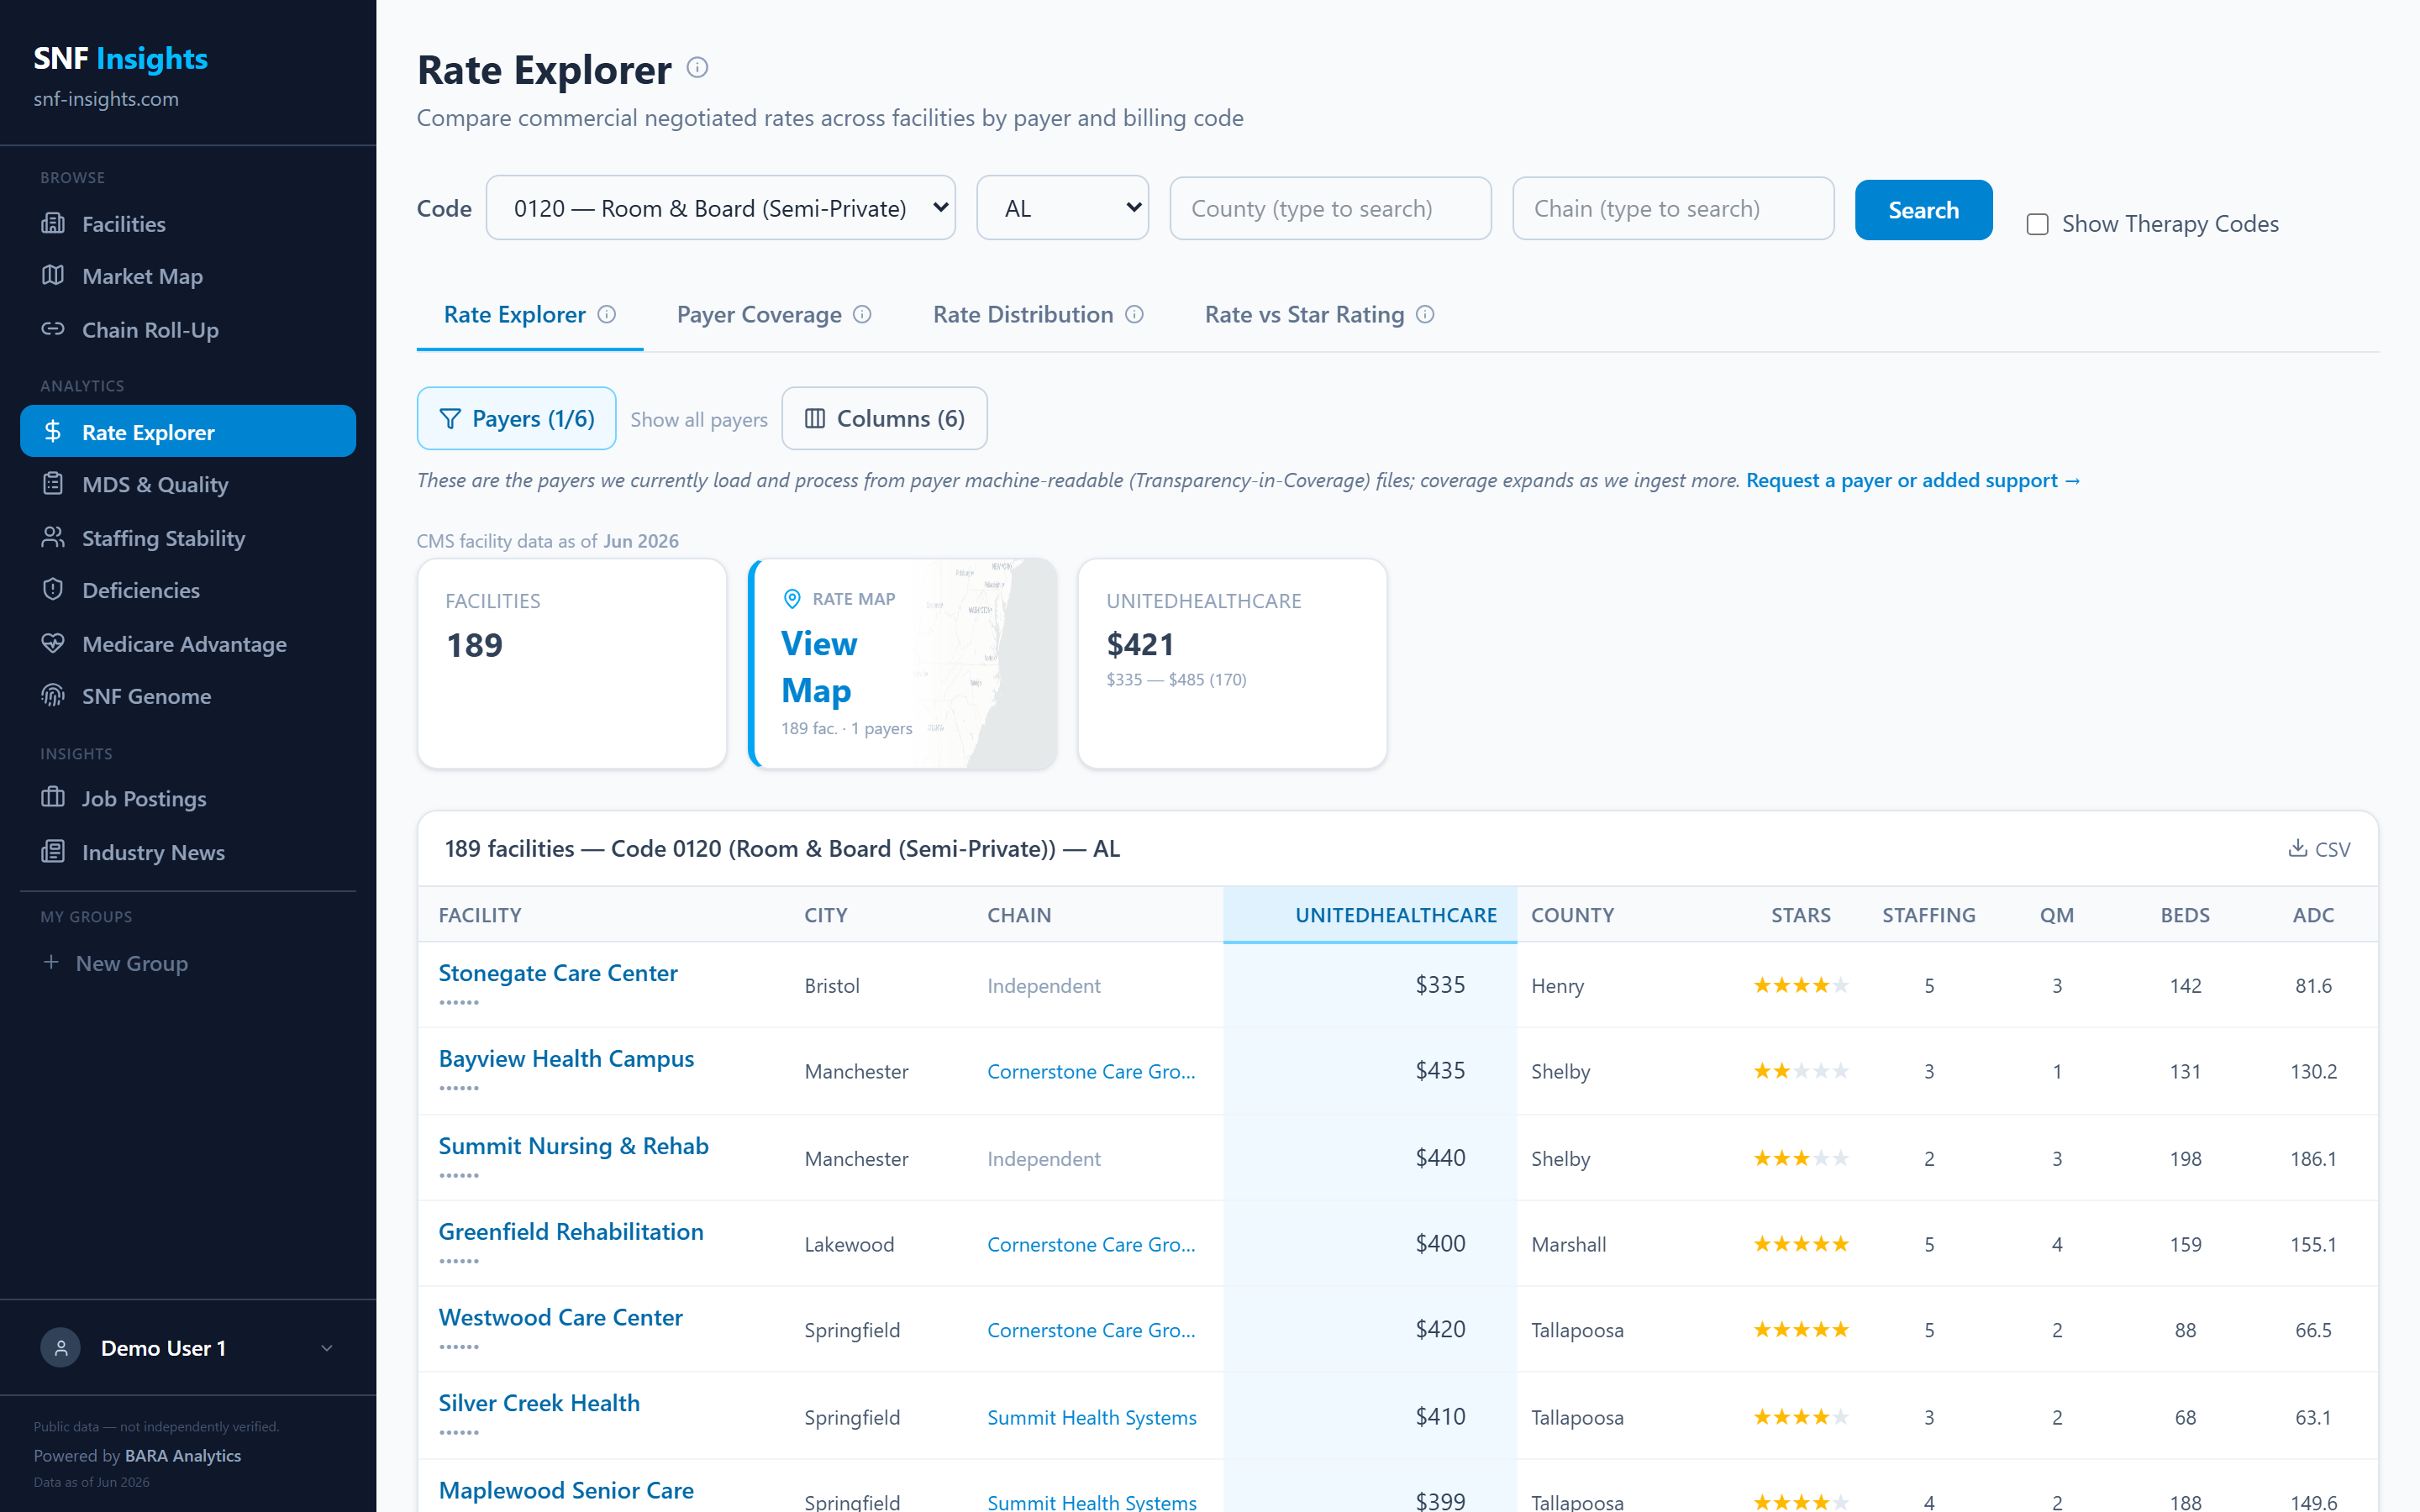
See what facilities are actually paid
SNF Insights cleans and matches Transparency in Coverage data to facilities, so you can benchmark payer-negotiated rates against the peers that truly compare.
SNF Insights aggregates public and licensed data for informational and analytical purposes only. Commercial rate data sourced from Transparency in Coverage filings reflects rates as reported by payers and may not reflect actual contracted amounts or all applicable terms. This is not financial, legal, or professional advice.